GPS is not just about that fancy sat-nav box of tricks sitting on the dash, directing you effortlessly to your destination with the voice of your choice. As Alan Ruddock explains, it can provide coaches and athletes with invaluable information, enhancing training programmes and performance.
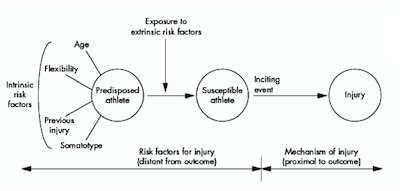
A global positioning system (GPS) device is more than just a talking black box. It’s a complex receiver designed to analyse information from a constellation of 24 satellites orbiting the earth at an altitude of 20,000km. A GPS receiver works by timing the GPS signals sent by a satellite; each satellite transmits the time a signal was sent and the GPS receiver then determines the transit time of the signal, and computes the longitude and latitude (position) of the GPS receiver on the earth’s surface (see figure 1,below, for a schematic diagram).

GPS was developed by the US Department of Defence during the 1960s as a means of guiding armed forces during combat. The US army maintained sole use of GPS for more than 20 years until an airline disaster in 1983 forced president Ronald Regan to make GPS available for civilian use to avoid such incidents in the future. Despite the availability of GPS, the initial accuracy for civilians was only 100 metres compared to a military accuracy of 20 metres. However, with technological developments and the aid of some powerful land mapping systems, it is now possible to obtain an accurate fix on positions of less than 10cms!
GPS and sport
The ability of GPS to locate position has numerous applications in sport and there are now hundreds of products aimed at sports ranging from running to paragliding. Recently there has been a drive by coaches to track players’ movements during competition, particularly in team sports such as soccer and rugby.
The development of semi-automated tracking systems (eg Pro-Zone) provides coaches with a breakdown of distances covered and speeds attained. Coaches can then evaluate performance and plan training using this information. Unfortunately, these tracking systems are only available in stadiums fitted with specific cameras and can only be used during matches. Furthermore it can take up to 48 hours to process the data, so the whole process is time consuming and costly.
Despite this, using GPS has become a popular option; it can be used to track the speed and distance of an individual without the rigidity of other tracking systems. Moreover, GPS equipment is portable, has the potential to provide real-time data and is reasonably accurate.
GPS accuracy
There have been several studies that have reported the accuracy, validity and reliability of GPS in sport. One of the earliest pieces of research was conducted ten years ago by Swiss researchers who wanted to explore whether differential GPS (DGPS) could accurately assess the speed of running(1). A single participant wore GPS equipment during a series of walking and running trials during which they compared actual speed and distance to the GPS-derived speed and distance.
The error (calculated by the coefficient of variation [CV]) of the DGPS for walking speed was reported to be as low as 1.38% and even better for running speed (0.82%). The degree of over- and underestimation of speed determined by the DGPS was lower than 0.2kmh for any single run – the equivalent of 0.3 seconds during a 200m run at 15kmh – which, as the authors state, is equivalent to human error when using a stopwatch.
Despite these seemingly accurate results, there were problems with the system. Although the DGPS update rate was set at 0.50Hz (one sample every two seconds), the results reported were based upon a sampling frequency of 0.17Hz, which means the GPS logged its position only every six seconds. However, six seconds is a long time in sport – Usain Bolt can cover just under 60 metres in six seconds!
Furthermore, the participant was moving mostly in straight line but this type of movement is not typical of patterns seen in sport, especially team sports where multi-directional sprints are common. Finally, the equipment list required to carry out this study was extensive; they needed a GPS receiver, DGPS receiver, antenna, a PC, and a car to carry everything apart from the GPS receiver. Clearly the cumbersome devices required in this study would be unsuitable for most team sports.
Two more recent studies have investigated the use of GPS in soccer without the need for a car to collect the data. A study conducted at the University of Granada, Spain, aimed to test the validity and reliability of a GPS device for measuring repeated sprint ability test (RSAT) variables(2). The group set up a series of timing gates and measured split times at 15 and 30m during a RSAT (7 x 30m maximal sprints with 30 seconds’
recovery). The 15m and 30m split times from the timing gates were well correlated with the times recorded via GPS, as were those for peak speed. However, encouraging as these results may seem, this study did not take into account that team sports almost always comprise of multiple changes in direction.
Participants in a second study covered a 128.5m circuit which consisted of multiple changes in direction as well as bouts of walking, jogging, fast running, sprinting and standing still(3). The researchers investigated three different GPS devices which logged data once every second (1Hz) during the trials.
All the GPS devices recorded significantly different average lap distances, which resulted in a CV between 4.0 and 7.2% and different average peak speeds of 21.3-21.9kmh. The authors concluded that all the devices showed an acceptable level of accuracy but that they may have been helped by the in-built accelerometer (a device that literally measures acceleration) to correct for the inherent error of 1Hz GPS. When the GPS signal strength dropped below a pre-determined threshold, the GPS device used the accelerometer to help improve its accuracy. In simple terms, this suggests is that GPS alone may not be sufficient to track players because of problems arising with loss of signal from the satellites. When this occurs, an accelerometer is required to ‘fill in the gaps’.
Nevertheless, other researchers have compared the activity patterns and fatigue development of professional footballers using two types of video based analysis(4): MCS – a semi-automatic camera system similar to Pro-Zone, and VTM – video based time-motion analysis. These were tested against two types of GPS (I and II) similar to those used in the study above(3). Of the variables measured and shown in table 1, perhaps the two most important are high intensity and sprinting distance because these are the intensities that have been associated with successful performance and a drop off in these indicates fatigue.

Large variations in high intensity distance were found between the measures (a CV greater than 25%), particularly between VTM and GPS-1 and the two GPS devices. These errors were even greater when comparing sprinting distance, with errors of up to 65% between GPS systems and 39% between MCS and GPS-1. Despite these errors, the group did find similar results in fatigue rate (expressed as the reduction in high intensity distance from the first 15-minute to the last 15-minute period).
The authors concluded that any comparisons between systems should be interpreted with caution. Yet it could be inferred that any of one of the systems may over/underestimate physiological player load and thus have important implications for managing players’ training. This study highlights the potential limitations of the technology being employed by elite teams and suggests that alternatives may be required to gain a more accurate understanding of player load during training and competition.
Practical applications
Currently there are no low-cost (sub £1,000/$1,500) GPS systems and associated software on the market for team sports. However, with a little ingenuity it is possible to create your own system, which may provide you with some of the information available to elite teams using the top-level systems. Essential to this process is the choice of GPS receiver. During our research we choose the Q-starz BT-Q1300s (www.qstarz.com) sports recorder because of its low cost (£70), unobtrusive, lightweight design, use of differential GPS, its ability to log position in its internal memory and most importantly, its ability to log at 5Hz (five times per second) with a little tweaking using the BT747 programme (www.bt747.org).
After recording an event, the data was uploaded using the mini USB cable provided to the Q-starz software, the coordinates were then exported and analysed in a custom-designed application. Alternatively, it is possible to use the speed output from the Q-starz software to calculate distance. We designed the application due to the lack of specific software available for team sports but there are several very good free applications available to track movement.
SportsTracks
(www.zonefivesoftware.com/SportTracks)
A favourite with orienteers and endurance athletes, the format is similar to heart rate monitoring software such as Polar Pro Trainer whereby a log book is used to store training run information. Of particular use to team sports is the use of the ‘activity split analysis’ function. This allows the user to view the breakdown of a particular period in terms of time and distance. Another useful function is an ‘export to Google Earth’ option whereby users can visualise their route in more detail than the map offered by SportsTracks. The developers of sports tracks are always looking for and adding new functions, one of which may be a team sport analysis function in the near future.
GPS Visualizer (www.gpsvisualizer.com)
Again, GPS Visualizer is much more suited to endurance sports but also has some useful features for team sports. For example, you can export your data to Google Earth and colourise your track by speed. So for example, high intensity speeds are shown by red markings and lower speeds are blue. Using this option will allow you to identify hot-spots of movement around the location of interest.
QSports (software accompanying GPS receiver)
Similar to SportsTracks but oriented more towards the health market. It provides some useful information regarding speed and distance.
We conducted a small trial with the QSports GPS logger using a similar approach in the study above(3). Unfortunately, our unpublished reports suggest that the GPS receiver was unable to detect small changes in speed and movement typical of those in team sports. The main problem with the GPS receiver was the type of satellite fix it obtained; in order to get the most accurate results, the GPS receiver required a differential fix. However, it could only acquire a standard fix where the positions can only be calculated to within 10 metres. Obviously this is not accurate enough to analyse player movement and this is probably why the high performance systems are also fitted with highly sensitive accelerometers to assist in detection when satellite fixes are sub-optimal.
Future applications
GPS technology for team sport still has a long way to go to match the validity of other biological measurement devices such as
blood lactate and gas analysis. However, there are some emerging technologies that have the potential to meet the high-accuracy demands of elite sport tracking.
Accelerometers
Recent developments in miniature low-power processors and inertial sensors have enabled accurate movement tracking in real time. Foot pods such as the Polar S(3) use digital signal processing techniques that identify the typical acceleration traces/gait events of walking, jogging, running and sprinting to provide running speed and distance to the user.
Although the system is ideal for running, it only measures forward and vertical acceleration, which is a problem for the majority of sports where multi-directional movement is common. Even though it is designed for running it still has problems because the foot pod will never be directly aligned to the direction of running and consequently lateral rolling motions of the foot during running may result in small measurement inaccuracies. However, after a simple calibration, runners can be confident that 99% of the time, the speed that is recorded is their actual speed.
Wireless location sensors (WLS)
Scientists at the Commonwealth Scientific and Industrial Research Organisation (CSIRO) have developed a wireless location system that uses radio signals to detect any tagged object – such as an athlete. Anchor nodes (which can be likened to Wi-Fi boxes) are set up in known locations around the area of interest and communicate wirelessly with a small mobile tag to determine the range between the anchor nodes.
According to the developers, the advantages of this system over others are that it is low cost, has an update rate of 25 Hz (25 times per second), is highly portable with a rapid set-up, operates indoors (which GPS can’t because receivers need a clear view of satellites) and has a high accuracy level. A recent report presented at a conference in Australia indicated that the positional accuracy of the WLS ranged from 1 metre indoors to just 0.15 metres outdoors. The research group has already been working with Australian Institute of Sport cyclists to track cyclists’ positions in the velodrome and the system seems to provide highly accurate split times. Further work is being carried out with soccer, basketball and canoeing, and in the future it will be possible to add on other sensors to measure heart rate and skin temperature.
Local positioning measurement (LPM – see figure 2)
This system works on a similar principle to WLS in that each player wears a tag (transponder) which transmits information regarding its position to base stations situated around the area of play. What’s interesting is that this system already has the capability to transmit heart rate data and more impressively, generate real time computer images of all players wearing the device, using special cameras mounted on the base stations. Factor in a 5cm positioning accuracy and a 1GHz (a billion times a second!) update rate and you have a very powerful player tracking device. Top European soccer clubs are already using it; AC Milan, Bayern Munich and PSV Eindhoven all have this system installed at their training grounds but at present there is no scientific literature available comparing this against other player tracking systems. The LPM is also being used in speed skating and ice hockey to provide coaches with objective performance data to enhance performance.
Summary
The requirement for objective measures of performance and the physical demands during training and competition has lead to the widespread use of GPS technology in sport. GPS systems applicable to sports teams have demonstrated an acceptable level of accuracy and validity. However, there are currently no low-cost GPS units or software designed for use in team sports that could be used as a cost effective method for analysing performance, although there are several alternative options available to coaches.
In the future, it’s likely that GPS or other tracking devices will be linked to media coverage so that fans can view real-time performance data of players during competition! The Elite Sport Performance Research in Training with Pervasive Sensing (ESPRIT) research group are developing body sensor networks that will combine emerging wireless technologies and link positional data with heart rate, skin temperature (even core temperature with ingestible short range telemetric pills), muscle oxygenation and biomechanical data to provide coaches with objective performance data which can be used to enhance performance.
Alan Ruddock MSc, CSCS, YCS is a researcher in exercise physiology at Sheffield Hallam University, UK
References
1. Med Sci Sports Exerc. 2000 Mar; 32(3): 642-6
2. J Sci Med Sport. 2009. Article in press.
3. J Sci Med Sport. 2010 Jan; 13 (1): 133-5
4. J Sports Sci. 2010 Jan; 28(2): 171-182