Thursday, October 10, 2013

Influence of field position and phase of play on the physical demands of match-play in professional rugby league forwards


Gabbett (in press), Journal of Science and Medicine in Sport

Documented by Samir Franciscus

Introduction

  • Previous research have shown backs cover greater distances compared to forwards in elite rugby league match-play
  • Forwards been shown to experience greater post-match muscle damage compared to backs due to repeated blunt force trauma
  • Only one previous study has compared the physical demands of rugby league attack and defence, with data only collected from 3 matches (limited representation of demands)
  • No study has investigated the influence of field position on physical movement demands between attack and defence

Methods

  • 22 elite professional rugby league players wore Catapult Minimax GPS devices (sampling at 10Hz) across a full season consisting of 23 matches
  • Video footage simultaneously collected and manually synced with GPS software in order to ‘code’ the attacking and defensive phases of play when the ball was in-play only
  • Data categorised into movement speed bands (low speed = 0-5 m/s and high speed = >5 m/s), collision bands (mild = 1-2 G, moderate = 2.1-4 G, heavy = >4 G) and repeated high-intensity efforts (3 or more high acceleration (>2.79 m/s2), high speed or contact efforts with less than 21 secs recovery between efforts)
  • Field position analysis separated into 6 positional zones, 3 attacking zones (dead ball line to 30m line, 30m line to opposing 70m line, 70m line to attacking dead ball line) and 3 defensive zones (oppositions dead ball line to 30m line, oppositions 30m line to 70m line, 70m line to dead ball line)

Results

  • Physical demands of defence were consistently greater compared to attack, with significant differences found for total distance covered (109 ± 16 m/min vs. 82 ± 12 m/min), low speed distance (104 ± 15 m/min vs. 78 ± 11 m/min), high speed distance (5.3 ± 3.7 m/min vs. 3.9 ± 3.0 m/min), frequency of collisions (1.9 ± 0.7 per min vs. 0.8 ± 0.3/min) and repeated high-intensity efforts (1 every 4.9 ± 5.1 min vs. 1 every 9.4 ± 6.1 min)
  • Defending in the opposition’s 30m zone and attacking in the middle third associated with greatest running distances
  • High speed running performing defending in the opposition’s 30m zone was 6-8 times greater than when defending in middle third or team’s own try line
  • Frequency of repeated high-intensity effort bouts greater when attacking opposition’s try line and defending own try line

Practical Implications

  • This study highlights the importance of maintaining a high playing intensity during elite rugby league match-play, particularly when defending in the opposition’s 30m zone which may restrict the territory gained by the opposition
  • Previous work reported 70% of tries scored occurred in close proximity to a repeated high-intensity bout (Austin et al. 2011), thus maintaining high playing intensity could also be crucial to optimise try scoring opportunities
  • Specific training drills could be designed to replicate the attacking and defensive demands demonstrated in the present study

Wednesday, April 24, 2013

Sports Equipment: is GPS the best route to performance analysis?


GPS can provide coaches and athletes with invaluable information, enhancing training programmes and performance

GPS is not just about that fancy sat-nav box of tricks sitting on the dash, directing you effortlessly to your destination with the voice of your choice. As Alan Ruddock explains, it can provide coaches and athletes with invaluable information, enhancing training programmes and performance.
A global positioning system (GPS) device is more than just a talking black box. It’s a complex receiver designed to analyse information from a constellation of 24 satellites orbiting the earth at an altitude of 20,000km. A GPS receiver works by timing the GPS signals sent by a satellite; each satellite transmits the time a signal was sent and the GPS receiver then determines the transit time of the signal, and computes the longitude and latitude (position) of the GPS receiver on the earth’s surface (see figure 1,below, for a schematic diagram).
GPS was developed by the US Department of Defence during the 1960s as a means of guiding armed forces during combat. The US army maintained sole use of GPS for more than 20 years until an airline disaster in 1983 forced president Ronald Regan to make GPS available for civilian use to avoid such incidents in the future. Despite the availability of GPS, the initial accuracy for civilians was only 100 metres compared to a military accuracy of 20 metres. However, with technological developments and the aid of some powerful land mapping systems, it is now possible to obtain an accurate fix on positions of less than 10cms!

GPS and sport

The ability of GPS to locate position has numerous applications in sport and there are now hundreds of products aimed at sports ranging from running to paragliding. Recently there has been a drive by coaches to track players’ movements during competition, particularly in team sports such as soccer and rugby.
The development of semi-automated tracking systems (eg Pro-Zone) provides coaches with a breakdown of distances covered and speeds attained. Coaches can then evaluate performance and plan training using this information. Unfortunately, these tracking systems are only available in stadiums fitted with specific cameras and can only be used during matches. Furthermore it can take up to 48 hours to process the data, so the whole process is time consuming and costly.
Despite this, using GPS has become a popular option; it can be used to track the speed and distance of an individual without the rigidity of other tracking systems. Moreover, GPS equipment is portable, has the potential to provide real-time data and is reasonably accurate.

GPS accuracy

There have been several studies that have reported the accuracy, validity and reliability of GPS in sport. One of the earliest pieces of research was conducted ten years ago by Swiss researchers who wanted to explore whether differential GPS (DGPS) could accurately assess the speed of running(1). A single participant wore GPS equipment during a series of walking and running trials during which they compared actual speed and distance to the GPS-derived speed and distance.
The error (calculated by the coefficient of variation [CV]) of the DGPS for walking speed was reported to be as low as 1.38% and even better for running speed (0.82%). The degree of over- and underestimation of speed determined by the DGPS was lower than 0.2kmh for any single run – the equivalent of 0.3 seconds during a 200m run at 15kmh – which, as the authors state, is equivalent to human error when using a stopwatch.
Despite these seemingly accurate results, there were problems with the system. Although the DGPS update rate was set at 0.50Hz (one sample every two seconds), the results reported were based upon a sampling frequency of 0.17Hz, which means the GPS logged its position only every six seconds. However, six seconds is a long time in sport – Usain Bolt can cover just under 60 metres in six seconds!
Furthermore, the participant was moving mostly in straight line but this type of movement is not typical of patterns seen in sport, especially team sports where multi-directional sprints are common. Finally, the equipment list required to carry out this study was extensive; they needed a GPS receiver, DGPS receiver, antenna, a PC, and a car to carry everything apart from the GPS receiver. Clearly the cumbersome devices required in this study would be unsuitable for most team sports.
Two more recent studies have investigated the use of GPS in soccer without the need for a car to collect the data. A study conducted at the University of Granada, Spain, aimed to test the validity and reliability of a GPS device for measuring repeated sprint ability test (RSAT) variables(2). The group set up a series of timing gates and measured split times at 15 and 30m during a RSAT (7 x 30m maximal sprints with 30 seconds’ recovery). The 15m and 30m split times from the timing gates were well correlated with the times recorded via GPS, as were those for peak speed. However, encouraging as these results may seem, this study did not take into account that team sports almost always comprise of multiple changes in direction.
Participants in a second study covered a 128.5m circuit which consisted of multiple changes in direction as well as bouts of walking, jogging, fast running, sprinting and standing still(3). The researchers investigated three different GPS devices which logged data once every second (1Hz) during the trials.
All the GPS devices recorded significantly different average lap distances, which resulted in a CV between 4.0 and 7.2% and different average peak speeds of 21.3-21.9kmh. The authors concluded that all the devices showed an acceptable level of accuracy but that they may have been helped by the in-built accelerometer (a device that literally measures acceleration) to correct for the inherent error of 1Hz GPS. When the GPS signal strength dropped below a pre-determined threshold, the GPS device used the accelerometer to help improve its accuracy. In simple terms, this suggests is that GPS alone may not be sufficient to track players because of problems arising with loss of signal from the satellites. When this occurs, an accelerometer is required to ‘fill in the gaps’.
Nevertheless, other researchers have compared the activity patterns and fatigue development of professional footballers using two types of video based analysis(4): MCS – a semi-automatic camera system similar to Pro-Zone, and VTM – video based time-motion analysis. These were tested against two types of GPS (I and II) similar to those used in the study above(3). Of the variables measured and shown in table 1, perhaps the two most important are high intensity and sprinting distance because these are the intensities that have been associated with successful performance and a drop off in these indicates fatigue.
Large variations in high intensity distance were found between the measures (a CV greater than 25%), particularly between VTM and GPS-1 and the two GPS devices. These errors were even greater when comparing sprinting distance, with errors of up to 65% between GPS systems and 39% between MCS and GPS-1. Despite these errors, the group did find similar results in fatigue rate (expressed as the reduction in high intensity distance from the first 15-minute to the last 15-minute period).
The authors concluded that any comparisons between systems should be interpreted with caution. Yet it could be inferred that any of one of the systems may over/underestimate physiological player load and thus have important implications for managing players’ training. This study highlights the potential limitations of the technology being employed by elite teams and suggests that alternatives may be required to gain a more accurate understanding of player load during training and competition.

Practical applications

Currently there are no low-cost (sub £1,000/$1,500) GPS systems and associated software on the market for team sports. However, with a little ingenuity it is possible to create your own system, which may provide you with some of the information available to elite teams using the top-level systems. Essential to this process is the choice of GPS receiver. During our research we choose the Q-starz BT-Q1300s (www.qstarz.com) sports recorder because of its low cost (£70), unobtrusive, lightweight design, use of differential GPS, its ability to log position in its internal memory and most importantly, its ability to log at 5Hz (five times per second) with a little tweaking using the BT747 programme (www.bt747.org).
After recording an event, the data was uploaded using the mini USB cable provided to the Q-starz software, the coordinates were then exported and analysed in a custom-designed application. Alternatively, it is possible to use the speed output from the Q-starz software to calculate distance. We designed the application due to the lack of specific software available for team sports but there are several very good free applications available to track movement.
SportsTracks
(www.zonefivesoftware.com/SportTracks)
A favourite with orienteers and endurance athletes, the format is similar to heart rate monitoring software such as Polar Pro Trainer whereby a log book is used to store training run information. Of particular use to team sports is the use of the ‘activity split analysis’ function. This allows the user to view the breakdown of a particular period in terms of time and distance. Another useful function is an ‘export to Google Earth’ option whereby users can visualise their route in more detail than the map offered by SportsTracks. The developers of sports tracks are always looking for and adding new functions, one of which may be a team sport analysis function in the near future.
GPS Visualizer (www.gpsvisualizer.com)
Again, GPS Visualizer is much more suited to endurance sports but also has some useful features for team sports. For example, you can export your data to Google Earth and colourise your track by speed. So for example, high intensity speeds are shown by red markings and lower speeds are blue. Using this option will allow you to identify hot-spots of movement around the location of interest.

QSports (software accompanying GPS receiver)

Similar to SportsTracks but oriented more towards the health market. It provides some useful information regarding speed and distance.
 We conducted a small trial with the QSports GPS logger using a similar approach in the study above(3). Unfortunately, our unpublished reports suggest that the GPS receiver was unable to detect small changes in speed and movement typical of those in team sports. The main problem with the GPS receiver was the type of satellite fix it obtained; in order to get the most accurate results, the GPS receiver required a differential fix. However, it could only acquire a standard fix where the positions can only be calculated to within 10 metres. Obviously this is not accurate enough to analyse player movement and this is probably why the high performance systems are also fitted with highly sensitive accelerometers to assist in detection when satellite fixes are sub-optimal.

Future applications

GPS technology for team sport still has a long way to go to match the validity of other biological measurement devices such as blood lactate and gas analysis. However, there are some emerging technologies that have the potential to meet the high-accuracy demands of elite sport tracking.
Accelerometers
Recent developments in miniature low-power processors and inertial sensors have enabled accurate movement tracking in real time. Foot pods such as the Polar S(3) use digital signal processing techniques that identify the typical acceleration traces/gait events of walking, jogging, running and sprinting to provide running speed and distance to the user.
Although the system is ideal for running, it only measures forward and vertical acceleration, which is a problem for the majority of sports where multi-directional movement is common. Even though it is designed for running it still has problems because the foot pod will never be directly aligned to the direction of running and consequently lateral rolling motions of the foot during running may result in small measurement inaccuracies. However, after a simple calibration, runners can be confident that 99% of the time, the speed that is recorded is their actual speed.
Wireless location sensors (WLS)
Scientists at the Commonwealth Scientific and Industrial Research Organisation (CSIRO) have developed a wireless location system that uses radio signals to detect any tagged object – such as an athlete. Anchor nodes (which can be likened to Wi-Fi boxes) are set up in known locations around the area of interest and communicate wirelessly with a small mobile tag to determine the range between the anchor nodes.
According to the developers, the advantages of this system over others are that it is low cost, has an update rate of 25 Hz (25 times per second), is highly portable with a rapid set-up, operates indoors (which GPS can’t because receivers need a clear view of satellites) and has a high accuracy level. A recent report presented at a conference in Australia indicated that the positional accuracy of the WLS ranged from 1 metre indoors to just 0.15 metres outdoors. The research group has already been working with Australian Institute of Sport cyclists to track cyclists’ positions in the velodrome and the system seems to provide highly accurate split times. Further work is being carried out with soccer, basketball and canoeing, and in the future it will be possible to add on other sensors to measure heart rate and skin temperature.

Local positioning measurement (LPM – see figure 2)
This system works on a similar principle to WLS in that each player wears a tag (transponder) which transmits information regarding its position to base stations situated around the area of play. What’s interesting is that this system already has the capability to transmit heart rate data and more impressively, generate real time computer images of all players wearing the device, using special cameras mounted on the base stations. Factor in a 5cm positioning accuracy and a 1GHz (a billion times a second!) update rate and you have a very powerful player tracking device. Top European soccer clubs are already using it; AC Milan, Bayern Munich and PSV Eindhoven all have this system installed at their training grounds but at present there is no scientific literature available comparing this against other player tracking systems. The LPM is also being used in speed skating and ice hockey to provide coaches with objective performance data to enhance performance.

Summary

The requirement for objective measures of performance and the physical demands during training and competition has lead to the widespread use of GPS technology in sport. GPS systems applicable to sports teams have demonstrated an acceptable level of accuracy and validity. However, there are currently no low-cost GPS units or software designed for use in team sports that could be used as a cost effective method for analysing performance, although there are several alternative options available to coaches.
In the future, it’s likely that GPS or other tracking devices will be linked to media coverage so that fans can view real-time performance data of players during competition! The Elite Sport Performance Research in Training with Pervasive Sensing (ESPRIT) research group are developing body sensor networks that will combine emerging wireless technologies and link positional data with heart rate, skin temperature (even core temperature with ingestible short range telemetric pills), muscle oxygenation and biomechanical data to provide coaches with objective performance data which can be used to enhance performance.
Alan Ruddock MSc, CSCS, YCS is a researcher in exercise physiology at Sheffield Hallam University, UK
References
1. Med Sci Sports Exerc. 2000 Mar; 32(3): 642-6
2. J Sci Med Sport. 2009. Article in press.
3. J Sci Med Sport. 2010 Jan; 13 (1): 133-5
4. J Sports Sci. 2010 Jan; 28(2): 171-182

Tuesday, January 15, 2013

Football Physics: The Anatomy of a Hit


Researchers are using new tools to study the science of a football fundamental: the tackle.

BY MATT HIGGINS


It happens about 100 times a game in the National Football League: a bone-jarring tackle that slams a player to the turf. On the play shown in the photo above, Seattle Seahawks defensive back Marcus Trufant (23) drilled Philadelphia Eagles receiver Greg Lewis (83) with such force that Lewis couldn't hang on to the ball. (Seattle won the Dec. 5, 2005, game at Philadelphia 42-0 in the most lopsided shutout ever broadcast on Monday Night Football.) Incompletions and fumbles aren't the only consequences of such tackles. More than 100 concussions are recorded each season in the NFL. Given the size and speed of today's athletes, it's surprising that more gridiron warriors aren't carried off the field on their shields. For that, they can thank high-tech gear that protects them from the physics at play in the sport's fearsome collisions.

HALF A TON OF HURT


At 5 ft. 11 in. and 199 pounds, Marcus Trufant is an average-size NFL defensive back (DB). Those stats don't stand out in a league where more than 500 players weighed 300-plus pounds at the 2006 training camps. But a DB's mass combined with his speed -- on average, 4.56 seconds for the 40-yard dash -- can produce up to 1600 pounds of tackling force, according to Timothy Gay, a physics professor at the University of Nebraska and author of The Physics of Football.

HITTING THE DECK


Researchers rate a field's shock absorbency with a metric called G-Max. To measure it, an object that approximates a human head and neck (about 20 sq. in. and 20 pounds) is dropped from a height of 2 ft. A low G-Max means the field absorbs more energy than the player. Trufant and Lewis landed on grass in Philly's new stadium, which has a cushy G-Max of just over 60. Synthetic surfaces have G-Max ratings of up to 120. The hardest turf: frozen grass.

LUGGING THE G-LOAD


Most people associate high g-forces with fighter pilots or astronauts. But common earthbound events can also boost g's. Few things can match the g-load of a wicked football hit.

ENERGY DISTRIBUTION


A tackle with half a ton of force sounds like a crippling blow. But, according to John Melvin, an injury biomechanics researcher for General Motors and NASCAR, the body can handle twice that amount -- as long as the impact is well-distributed. That job usually is handled by the player's equipment, which spreads out the incoming energy, lessening its severity.

BODY ARMOR


According to Tony Egues, head equipment manager for the Miami Dolphins, shoulder-pad plastic hasn't changed much in 25 years, but it is now molded into designs with more right angles to deflect impacts. Players also rely on the helmet's solid shell and face mask to redistribute the energy of a collision.

MEMORY FOAM


During a tackle, foam padding beneath the plastic components of equipment compresses, absorbing energy and reducing the speed of impact. (The slower a hit, the less force it generates.) Visco elastic foam, which was invented by NASA to protect astronauts from g-forces during liftoff, retains its shape better than conventional foam, rebounding rapidly after hits.

SCHOOL OF HARD KNOCKS


According to a Virginia Tech study, a tackle like Trufant's probably caused Lewis's head to accelerate in his helmet at 30 to 60 g's. VT researchers gather data with the Head Impact Telemetry System, which employs sensors and wireless transmitters in helmets. "We see 100-g impacts all the time," says Stefan Duma, director of the university's Center for Injury Biomechanics, "and several over 150 g's."

CHINKS IN THE ARMOR


While Trufant and Lewis generally have enjoyed healthy careers, they (and other players) face the same nemesis: the dreaded knee injury. The knee's anterior cruciate ligament can withstand nearly 500 pounds of pressure, but it tears far more easily from side hits and evasive maneuvers. According to the Pittsburgh Tribune-Review, more than 1200 knee injuries were reported by the league between 2000 and 2003, accounting for one out of every six injuries -- by far the highest percentage in the NFL.

Additional reporting by Emily Masamitsu and Davin Coburn

http://www.popularmechanics.com/outdoors/sports/physics/4212171

Rugby Shoulder Injuries - Prevention & Screening


Shoulder injuries are common with the highest proportion of missed playing days after any regional injury of the body.  This is naturally a growing concern for players, coaches and clubs in a high demand sport.

Before we can look at methods of prevention and screening we need to understand the risk factors for injury of the shoulder in rugby and how to reduce these risk factors. In this article I hope to summarise the key elements that have been studied so far.

Training, Speed and Aerobic Capacity
Gabbett & Domrow (AJSM 2005) evaluated performance risk factors in rugby league.  They found that players who had completed less than eighteen weeks of training before sustaining an initial injury were at a high risk of recurrent injury. The risk of injury was also greater in players with a low 10 and 40 metre speed in running.  Players with a low maximal aerobic power also had a greater risk of sustaining a contact injury.  They concluded that the findings highlighted the importance of speed and endurance training to enhance performance and reduce the incidence of injury in rugby.

Forces
The forces involved in rugby have increased over the years where the size of rugby players in rugby union increased from 94kgs in the 1980’s to 110kgs in the 2000’s in the forward pack.  The predicted weight of rugby union forwards in the 2020’s is expected to be a 121kgs.  In the backs the average weight in the 1980’s was 78kgs, 90kgs in the 2000’s and predicted to be 100kgs in the 2020’s.  Therefore a back in the 2020’s would be equivalent to the size and weight of a forward in the 1990’s.  Since force = mass x acceleration and rugby players are not only getting bigger and heavier but also getting faster the impact forces are predictably increasing.  In the 2010 Rugby League Four Nations the England team trialed GPS systems.  John Wilkin wrote in February 2010 “the new GPS system which we wore during the Four Nations attached to a man bra under our shirts consistently showed us that we were taking impacts of 10g’s and upwards during a match.  The gravity force of a car travelling at a 100kms per hour that comes to a stop in 0.2 seconds is 14.2g’s and we don’t have airbags.”  As you can see the forces involved in rugby tackles is equivalent to a car crash.

Fatigue
The hours lost to injury in international sport (per 1000 playing hours) is highest in rugby, this being 220 compared to 112 in American Football, 80 in ice hockey, 40 in football and 10 in cricket.  A factor thought to contribute to the increasing risk rate of injuries is also fatigue.  Peter Keen, former coach to Chris Boardman stated “nature has given the human body a wonderful engine management system.  It actually responds to stress by adapting to cope with it better.  The bottom line is the body does not get fitter through exercise, it gets fitter through recovering from exercise.”  In the graph below you can see the known effect of adaptation in response to work and recovery and you can see that tissue adaptation increases during the phase of recovery and significantly drops after the work and fatigue.  Periods of recovery are essential for the body to recuperate and become stronger.  


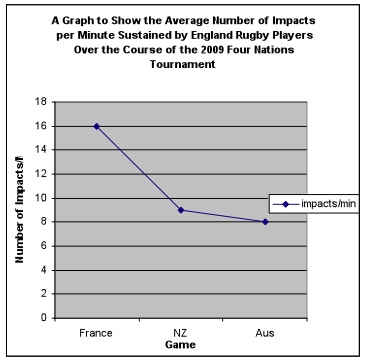
In addition to this we also performed a review of the GPS data from the 2010 Four Nations (Easton, Brewer, Hayton and Funk 2010).  We found that through the Four Nations tournament the number of impacts per minute decreased from 16 in the game against France to 8 in the game against Australia.  We felt this was an evidence of fatigue through the tournament.  There was also an increased associated incidence of injury.  Clive Brewer has stated “given that the majority of rugby league injuries occur in tackles and in the second half of matches, injury prevention strategies and physical fitness training could include game specific attacking and defensive drills practiced under fatigue conditions to encourage players to make appropriate decisions and apply learned skills during the pressure and fatigue of competitive matches.


Fuller et al. (BJSM 2007, 2008 and 2010) have shown in rugby union that tackling had the highest risk of upper limb injury.  The incidence was significantly higher in games than in training and there were more injuries in the second half of the game, again confirming the fatigue element.

proprioception
Herrington and Horsley have done a lot of work looking at the effect ofproprioception on shoulder injuries in rugby. They showed that matched rugby players had better joint position sense (JPS) than controls and also that non-injured rugby players had better JPS than players treated and rehabilitated following a shoulder injury. They concluded that a poor JPS is a possible predisposition to shoulder injury (Physical Therapy in Sport, 2010).

In 2008 ((Physical Therapy in Sport, 2008) the same group demonstrated that repetitive tackling of a tackle bag led to a reduced JPS at end of shoulder range of movement. This suggested that tackling fatigue led to poor JPS, and thus a higher risk of shoulder injury.


Isokinetic Strength
Nathan, Jones & Funk assessed isokinetic shoulder strength in rehabilitated rugby players after injury or surgery comparing these to non injured and rehabilitated players.  They found a significant increase in isokinetic strength in the rehabilitated players compared to the non injured players.  Therefore improving isokinetic strength may also reduce risk of injury.


Laxity
Another associated factor pre-disposing to injury is inherent shoulder laxity.  This has been shown by Cheng et al. JBJSB 2007 that rugby players with shoulder laxity as determined by static laxity testing of the shoulder had a higher risk ofdislocation in rugby.  Akhtar and Robinson BJSM 2010 showed a higher Beighton score in athletes who had suffered shoulder dislocations.  


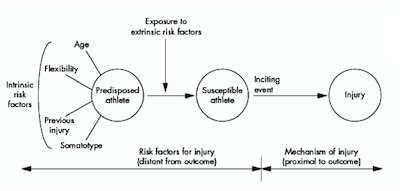
Meeuwiss & Fowler (Can.J. Sports Sci. 1988) developed an injury reduction pre-disposition model showing the complex interaction between internal and external risk factors as mentioned above.  This very eloquently summarises the effect of a pre-disposed athlete exposed to extrinsic risk factors making a susceptible athlete an inciting event on a susceptible athlete subsequently leads to injury.  It is these pre-dispositions and susceptibility that we wish to control with prevention and screening.  


Headey (American Journal of Sports Medicine 2007) summarised the issue by quoting “reducing the length of individual training sessions might be effective in reducing the incidents and severity of shoulder injury although further research into the optimal length of training sessions would be of clinical value specifically to assess the relationship between length of session and risk of any injury not simply damage to shoulders.  Any indication for a reduction in session duration to reduce injury burden would need to be balanced against the need to prepare adequately for matches and optimise skill development.”  

Conclusion
In summary the factors we have identified as possibly having an influence on shoulder injury risk in rugby are:

Player Factors: 
  1. Laxity
  2. proprioception
  3. Isokinetics
  4. Mass
  5. Running Speed
  6. Aerobic ability
  7. Previous Injury
Sport Factors: 
  1. Speed of play
  2. Timing
  3. Fatigue (Physical and Mental)
In this article we have reviewed the pre-disposing and risk factors to injury in rugby.  This provides a useful basis for introducing some foundations for an injury prevention programme.


http://www.shoulderdoc.co.uk/article.asp?article=1551

How Technology Is Changing The Economics Of Sports

Friday, October 19, 2012

Concussions: What’s your head worth?


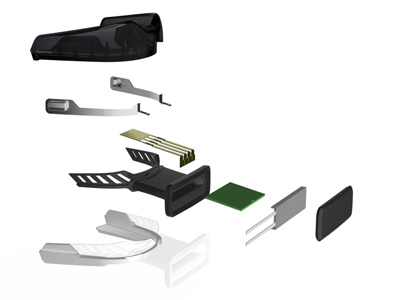
We’re introducing the world’s most exciting new sports technology platform. And the first mouthguard to accurately measure the impacts and accelerations experienced by the brain during sports – from inside the head. Form meets function with this innovative mouthguard which keeps you safer and provides superior comfort and fit.

Features

The Impact Sensing Mouthguard features a system of 3 axes of high G linear accelerometers and 3 axes of high-angular rate gyroscopes embedded to allow for accurate characterization of the full 6 axis acceleration waveform experienced internal to the subject’s skull.


The Impact Sensing Mouthguard transmits the data and information via a proprietary wireless protocol to a base station at the sideline, which athletic trainers and the team medical staff have access to.

Tuesday, September 11, 2012

Technology can help rugby, but only with a clearer vision of how and when to use it


I have seen the future and it is rugby robots. Bionic players remote-controlled by coaches who have built them from the latest components factories can offer.

Marching orders: Chris Ashton is sent to the sin bin after a review by by video at Twickenham; a classic example of how technology can help
Half human, half machine, their souls replaced by chips, their feelings and reactions swapped for the beep of computers calculating winning strategies.
Referees will fare no better, going from mistake-ridden humans to RoboCop enforcers who think 20 seconds to comply is far too slow.
In this world there are no mistakes, there are no reasons to complain about luck, the bounce of the ball, or the bizarre unfairness of a sport that operates like a high-speed roulette wheel of big hits and sprint finishes.
Sounds outlandish, but for a number of critics this is the road that we are racing down and the starting gun was fired by the latest set of rugby’s rule changes. The biggest worry is now over the use of the Television Match Official and accompanying technology.
It is a brilliant concept in itself and rugby would be adopting football’s Canute stance if it were to ignore the advances that have been made in helping referees do their job. Rugby league got there way before union and after years of practice, plus simple procedures and tight definitions of when it can and cannot be used, it has enhanced the game.
Rugby union is right to try to emulate this success and I am a fan of technology. How can you not be? The only problem we have is that no system is foolproof, no technology 100 per cent right, and because of this the changes themselves throw up almost as many questions as they manage to answer.
Look at the first weekend of the Premiership, which was as good as I can remember. The new TMO rules worked well in a number of cases, not least in the detection of foul play.
In the Saracens against London Irish match at Twickenham, Chris Ashton’s shoulder charge on Steve Shingler was reckless, and when reviewed resulted in a yellow card. Excellent teamwork between the referee on the field and his partner in the TV truck. The tackle by Ofisa Treviranus, of London Irish, on Charlie Hodgson looked awful at first sight and the snap decision could easily have been a red card. The review showed it for what it was – reckless but not deliberately decapitating. Yellow card awarded and again excellent work.
Another plus was the ability to check the position of a try scorer when the ball was kicked. In front of the kicker or not? Offside or not?
Nick Evans’s kick pass to Mike Brown on Saturday was checked by the officials. The player was onside. Great review, great try.
So far so good, and on this evidence, there is a lot to be said for the changes. But, look more closely and some issues are appearing.
How far back should you go?
This is the first point of clarity that is needed, especially when checking for a forward pass or knock-on in the build up to a try.
The new guidelines say the referee can go back to the start of the passage of play. That is fine when passages of play are reasonably short as they were over this first weekend. But what do you do when they become 40 phases or more?
It is not impossible: take the Heineken Cup match between Munster and Northampton at Thomond Park last year. There were more than 40 phases before Ronan O’Gara dropped a goal. There was no try, so there could be no referral, but there was a game-winning score after some four minutes of play. There was also a knock on after the first seven phases.
This needs to be clarified, not least the question of why you only refer a try and not any score that wins a match. Why should a dropped goal, or a penalty decision be any different? Until this is made clearer, I think any referral should be limited to the last phase and not the last restart. When you start going that far back, there will be too much to look at, too many possible incidents to take into consideration. It will slow the game down and add layers of complication.
How to define a forward pass
This is more complex. In keeping with my science-fiction theme, there is a heavy slice of physics at the heart of what is the biggest flaw in the system.
As a back my job was to push the boundaries. Ideally, I would be moving forward at pace, throwing the ball into space on a flat trajectory ahead of a team-mate who was also accelerating.
With all of this happening smoothly the ball would look like it was moving backwards, even though it was often actually travelling forwards, past the point from where I passed it. The movement of both players allowed this illusion of a backward pass to happen. What stopped it from looking correct was if I was tackled, or if anything caused a break in my momentum. As soon as I, the passer, was slowed, the pass looked forward. Last Saturday, the forward pass was a hot topic.
Referees have always had a way of trying to work – they look at the passer’s hands. Are they pointing backwards or forwards? It should be simple, only it is not, especially when you have to start considering movement, momentum, and intentions attempts to stay behind the ball as well.
Forward thinking? Key decisions from last weekend
I watched a lot of the TMO decisions back with Dewi Morris. We had the same access to the footage as the officials and we disagreed with each other and the TMO on a number of occasions.
1 Tom Varndell, of Wasps, scores what he thought was a bonu-point try on half-time against Harlequins. The referee was on the spot and gave nothing. It was the touch judge who referred it to the referee, who then passed it on to the TMO, who disallowed it, ruling that the pass between Nicky Robinson and Billy Vunipola, which took place well before the last passage, was forward. In my opinion the try was incorrectly ruled out.
2 Tim Payne, again of Wasps, scores a try in the second half. There was some quick interplay between Payne and Wentzel in the lead up, and the referee asked a pass to be reviewed. I believe he checked the wrong one. The Wentzel to Payne pass, the final one was fine. It was the one before that which was a problem. Try should have been ruled out and was down to poor communication between referee and TMO.
Bradley Barritt scores for Saracens against London Irish. In the build up, Joel Tomkins was put under pressure by Topsy Ojo, the London Irish defender. Ojo decided to blitz and shut his space down, knowing that the only way for the ball to move would be forward as Chris Wyles was clearly alongside Tomkins. The pass was forward but Saracens played on. Barritt got his try and Ojo’s good defence is negated. There was no referral from match officials.
4 Geoff Parling scores for Leicester v London Welsh. The Tigers try to come out of the hard in the second half to make a statement. Power runners, quick clearing out, the ball moves wide and Parling scores despite a forward pass from Anthony Allen when there was a clear movement of his hands going forward. Again, no referral, no checking of the build up.